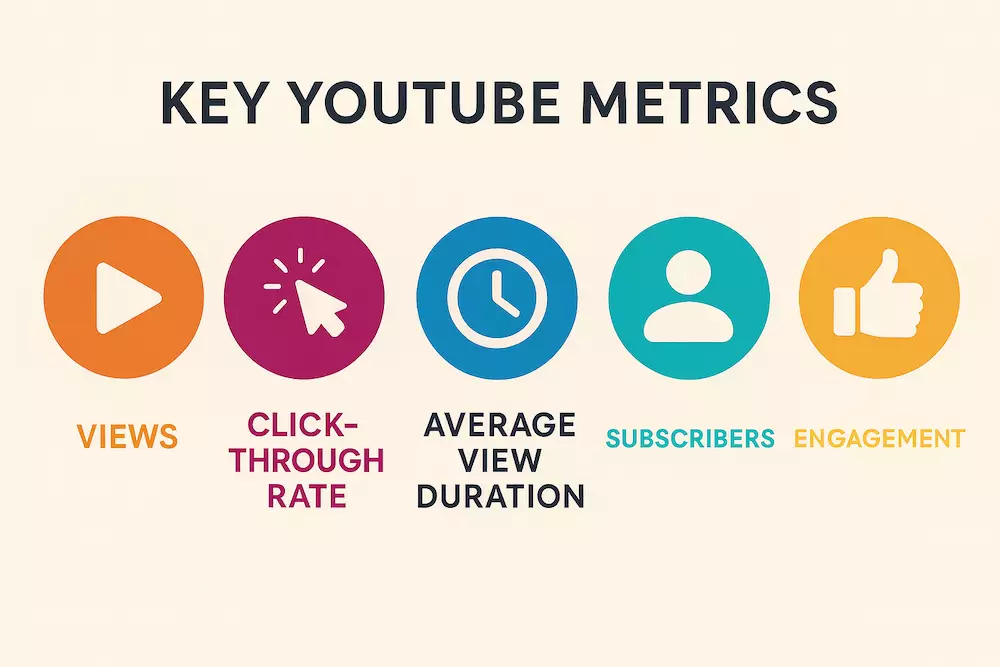
How to use YouTube Analytics without drowning in metrics
YouTube Analytics is useful when it helps you make one better decision for the next video. Start with a question, compare a consistent period, and read related metrics together. A single CTR, retention percentage, or subscriber number is not a diagnosis by itself.
This Guide uses a four-part review: reach tells you whether the idea and packaging earned opportunities and clicks; retention shows where the delivered video kept or lost attention; audience shows whether viewers are new or developing a habit; and a final decision log turns the evidence into one controlled change.
The 20-minute review workflow
- Choose the comparison before reading the result. Use a consistent window such as the last 28 days versus the previous 28 days for channel trends. For a single video, compare it with recent videos of a similar format, topic, age, and length. Do not compare a new Short with a six-month-old long-form tutorial.
- Check opportunity and choice. At channel level, open Analytics → Content; at video level, use Reach. Read impressions, impressions click-through rate, traffic sources, and views together. YouTube defines an impression as an eligible thumbnail appearance on YouTube, so external links, notifications, and some other surfaces are not included.
- Check whether the promise was delivered. At video level, open Overview or Engagement and inspect audience retention. Note the intro, gradual declines, top moments, spikes, and dips. YouTube says retention data usually takes one to two days to process, so do not diagnose a fresh upload too early.
- Check who is returning. Open Audience and look at monthly audience plus new, casual, and regular viewers. Subscriber count is not the same as active audience; YouTube describes monthly audience as a rolling 28-day estimate of people who actually watched.
- Write one next action. Record the evidence, your interpretation, one change for the next comparable video, and the date you will review it. Changing the topic, thumbnail style, opening, length, and upload time together makes the result impossible to interpret.
Read CTR in context, not against a magic benchmark
CTR tells you how often an eligible impression became a view. It is evidence about the combination of idea, title, thumbnail, surface, and audience—not a universal score for thumbnail quality. YouTube notes that CTR can fall when a video expands beyond its core audience, even while total impressions and views grow. Compare CTR with impressions and traffic sources before changing packaging.
| Pattern | Reasonable hypothesis | Next check |
|---|---|---|
| Impressions rising, CTR falling, views rising | The video may be reaching a broader audience | Check traffic-source mix and whether watch time remains useful |
| Impressions available, CTR weak versus comparable videos | The idea or packaging may not be clear enough | Review the title-thumbnail promise and the surface showing it |
| CTR strong, retention drops immediately | The opening may not deliver the promise people clicked | Compare the first 30 seconds with the title and thumbnail |
| CTR weak, retention strong among viewers | Useful content may be hidden behind weak packaging | Test a clearer promise without changing the video itself |
Read the retention curve as editing evidence
A flat section means viewers largely stayed through that part. A gradual decline is normal. A spike can indicate rewatching, sharing, or confusion; a dip can indicate skipping or abandonment. These shapes tell you where to investigate, not automatically why viewers behaved that way.
- Intro: Did the first 30 seconds match the expectation created by the title and thumbnail?
- Top moments: Can a strong example, reveal, or explanation appear earlier next time?
- Spikes: Was the moment valuable enough to rewatch, or unclear enough to require it?
- Dips: Did the video repeat itself, delay the answer, change topic, or include a removable interruption?
Use audience reports to separate reach from loyalty
New viewers show discovery; casual and regular viewers show repeated viewing behavior over longer periods. A growing channel can need both. Use new-viewer growth to evaluate whether topics reach beyond the existing audience, and casual or regular viewer growth to evaluate whether the channel gives people a recognizable reason to return.
Small channels should expect noisy data and missing audience reports. Use longer windows, compare groups of related videos, and avoid treating one upload as a verdict on the entire channel.
Your analysis note
| Field | Write this down |
|---|---|
| Question | What specific decision are you trying to make? |
| Comparison | Which period or genuinely comparable videos are you using? |
| Evidence | Which related metrics and graph moments support the observation? |
| Hypothesis | What is one plausible explanation, stated as a hypothesis rather than a fact? |
| Next action | What one controllable change will you make? |
| Review date | When will enough comparable data exist to evaluate it? |
Official metric references
- Get started with YouTube Analytics
- Decode impressions and click-through rate
- Measure key moments for audience retention
- Understand your YouTube audience
YouTube began rolling out an updated Studio experience in July 2026, so tab names or card positions may differ between accounts. Follow the metric and decision logic rather than memorizing one screenshot.