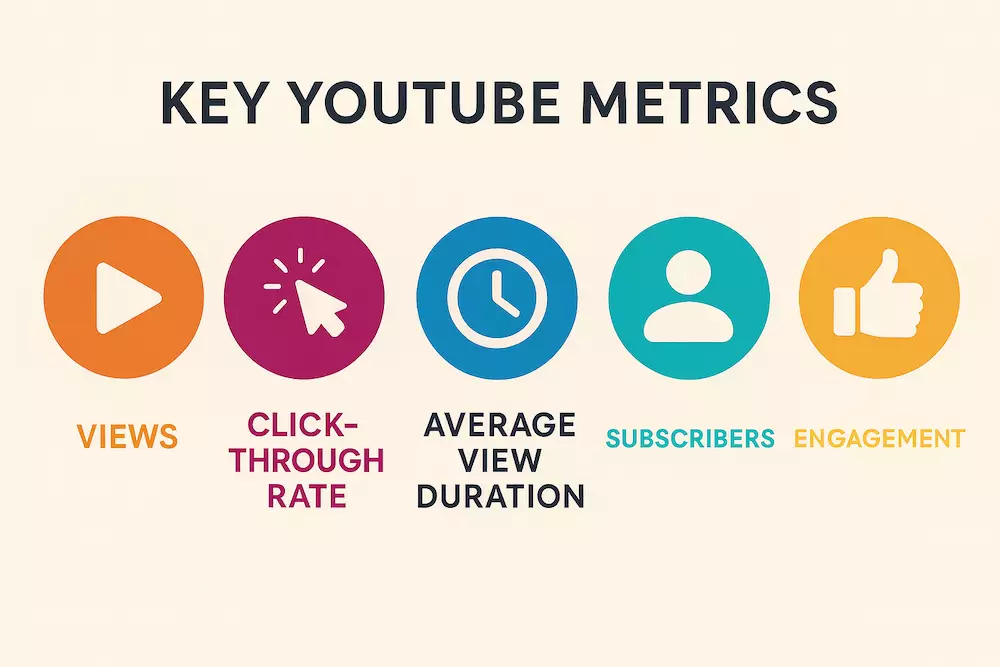
YouTube Analytics becomes useful when it answers a specific question about your next video. Beginners do not need to monitor every card in Studio. Start with three questions: Did YouTube show the idea to potential viewers? Did the video deliver the promise after they clicked? Are any viewers coming back?
This lesson explains the smallest useful set of metrics for answering those questions. For the complete review worksheet and diagnosis patterns, use the YouTube Analytics Guide.
Start with a fair comparison
Choose the comparison before looking for a success or failure story. At channel level, a rolling period such as the last 28 days versus the previous 28 days can show direction. At video level, compare videos with similar age, format, topic and length. A two-day-old upload, a Short and a six-month-old tutorial do not have the same opportunity or viewing behavior.
Use enough time for the relevant data to settle. YouTube says audience retention data usually takes one to two days to process. Some detailed or audience reports may also be unavailable when a channel or video has too little data.
Question 1: Did the idea earn opportunities and clicks?
At channel level, open Analytics → Content. For a single long-form video, open its Analytics and use Reach. Read these metrics together:
Impressions
Impressions count eligible times a thumbnail was shown on YouTube. They do not include every possible way somebody can encounter a video. External websites, notifications and some other surfaces are excluded, so impressions are not the same as total exposure.
Impressions click-through rate
CTR measures how often an eligible impression became a view. It reflects the combination of topic, title, thumbnail, surface and audience. There is no single target that makes a CTR automatically good or bad.
YouTube explains that CTR may decrease as a successful video reaches beyond its core audience. If impressions and views are increasing, a lower CTR can be part of healthy expansion. Compare CTR with impressions and traffic sources before changing the thumbnail.
Traffic sources
Traffic sources show how viewers found the video: for example Browse features, Suggested videos, YouTube Search or external sources. This context changes the meaning of CTR and the next action. Search traffic may indicate that the video answers a recurring question; Suggested traffic may reveal a strong relationship with another video; external traffic can create views without registered YouTube impressions.
| Evidence | Possible interpretation | What to inspect next |
|---|---|---|
| Impressions rise, CTR falls, views rise | The video may be expanding to a broader audience | Traffic sources and watch behavior |
| Impressions exist, CTR trails comparable videos | The idea or package may be unclear for that surface | Title-thumbnail promise and competing choices |
| Views rise without matching impressions | Traffic may come from sources not counted as impressions | External, direct or notification traffic |
Question 2: Did the video deliver its promise?
Open the video-level Overview or Engagement tab and inspect audience retention. Do not reduce retention to one percentage. The shape of the curve helps you locate moments worth reviewing.
- Intro: the percentage still watching after the first 30 seconds. Compare the opening with the expectation created by the title and thumbnail.
- Gradual decline: some loss over a video is normal. Look for changes that are unusually sharp compared with the surrounding section.
- Top moments: sections where few viewers left. Consider whether the valuable example or answer could appear earlier.
- Spikes: viewers may have rewatched or shared the moment, or the explanation may have been unclear. Watch the actual segment before deciding.
- Dips: viewers skipped or stopped watching around that moment. Check for repetition, delay, topic changes or an interruption.
Average view duration and watch time
Average view duration is the average time watched among views; watch time is the total time viewers spent watching. Both depend on the video’s length, traffic and audience. Use them to compare genuinely similar videos and to investigate the retention curve—not as proof that YouTube considers one channel more valuable than another.
Question 3: Are viewers developing a habit?
Open the channel-level Audience tab. Subscriber count is a historical total, not the size of the audience currently watching. YouTube’s monthly audience is a rolling 28-day estimate of viewers who watched your content.
- New viewers watched your channel for the first time in the selected period.
- Casual viewers have watched at least once per month for one to five months in the past year.
- Regular viewers have watched at least once per month for more than six months in the past year.
New-viewer growth can show that topics are reaching beyond the existing audience. Growth in casual or regular viewers can show that the channel gives people a recognizable reason to return. Small or new channels may have very low regular-viewer numbers because the definition requires a long viewing history; that alone is not a diagnosis.
Subscribers and engagement are outcomes, not complete explanations
Use subscribers to see which videos led people to make a longer-term commitment, but do not assume every subscriber will return for every upload. Likes, comments and shares can reveal reactions and community behavior, but a high count does not tell you by itself why a video received more reach. Avoid treating “the algorithm likes engagement” as an actionable analysis.
Turn the review into one next action
Finish each review with a short note:
- Question: what decision were you trying to make?
- Comparison: which period or comparable videos did you use?
- Evidence: which related metrics and graph moments did you observe?
- Hypothesis: what is one plausible explanation?
- Action: what one controllable change will you test?
- Review date: when will enough comparable data exist?
For example: “Video A received similar impressions to three recent tutorials but fewer clicks from Browse. The title describes the process but hides the result. On the next related tutorial, test a result-first title while keeping the format and opening structure similar.” That is more useful than “CTR is bad—make a better thumbnail.”
A beginner’s 20-minute Analytics checklist
- Use a consistent date range and a fair comparison group.
- Read impressions, CTR, views and traffic sources together.
- Watch the video at the first meaningful retention dip or spike.
- Compare active audience behavior with subscriber totals.
- Write one hypothesis, not a claim of certainty.
- Change one major variable and choose a future review date.
Do not judge the whole channel from one upload. A small set of related videos gives you a better comparison and keeps random variation from becoming strategy. If you are still preparing your first uploads, start with the beginner channel Guide and use Analytics after you have comparable attempts.
Official YouTube references
- Get started with YouTube Analytics
- Check impressions and watch time
- Decode impressions and CTR
- Measure audience retention
- Understand your audience
YouTube began rolling out an updated Studio experience in July 2026, so the exact location or name of a card may differ between accounts. Use the metric definitions and review sequence rather than memorizing one layout.